

It is not clear who exactly coined the immortal phrase, “Lies, Damn Lies and Statistics”.
Mark Twain attributed it to Disraeli.
But researchers have apparently found no evidence that the famous English politician had indeed come up with this phrase.
Be what may, it has been used ever since to indicate the seductive power of statistics, i.e., how data can be used to mislead people into believing something to be true when it is not.
But when used properly statistics can indeed bring us closer to the truth.
I was reminded of this in recent weeks as we got flooded with a deluge of comments and commentaries, and assertions and apprehensions, about rising imports and falling foreign exchange reserves, about the specter of debate default and that of exchange rate devaluations.
Social media is full of doomsday scenarios.
Articles in newspapers are relatively more sober but, here too, I am struck by the relatively sparse use of data to make a point.
Some newspapers are doing a commendable job of presenting good data, often in the form of attractive infographics.
But I believe more can be done.
I think we can dig deeper into data in at last three ways.
First, we can disaggregate economic variables instead of merely looking at some aggregate numbers.
Second, we can examine long run trends instead of being worked up with just short-term movements.
Third, we can explore relations among variables instead of looking at each in isolation.
Let me provide three examples to illustrate each case.
Disaggregating data: the case of imports
There is much talk and concern about Bangladesh's rising imports and the pressure this is putting on our forex reserves.
But imports lead to production (and hence growth) and since our main export RMG is heavily import-dependent, it leads to export earnings as well.
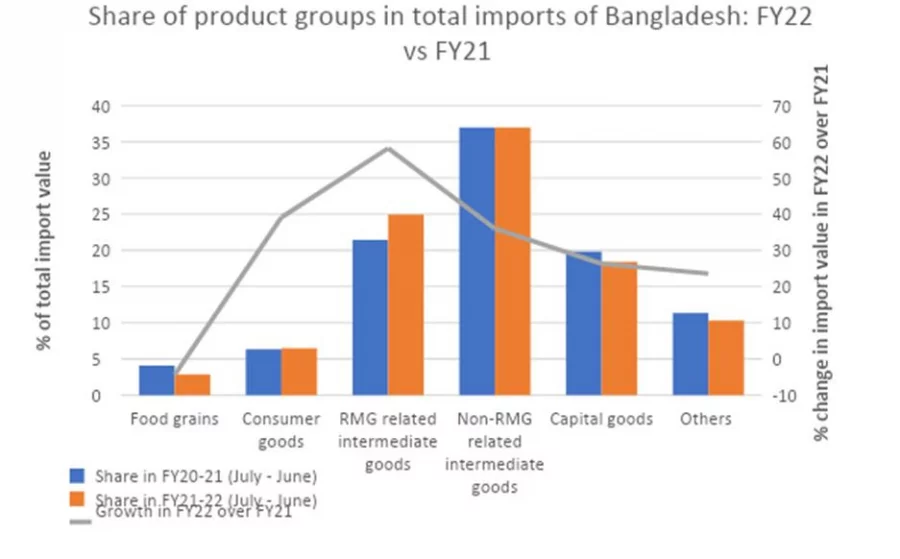
To put things in perspective, I analyzed import data for FY21 and FY22 and calculated shares of the main product groups in total imports for these two years and the percentage change between the years.
The results are interesting. In the chart below the shares of different product groups are shown on the left axis and the percentage change in import values on the right axis.
While total imports went up by 36% between FY21 and FY22, that of RMG related intermediate goods went up by 58% (grey line in graph), raising its share of total import value from 21% to 25% (bars in graph).
Other intermediate goods accounted for 37% in both years.
Some of these intermediate goods may be used to make other export products.
In other words, a sizable part of the increase in imports is going to help exports.
Some of this impact is already evident in the export growth of FY22 which was quite impressive, but some will be evident in this fiscal year.
Since we are concerned about the impact of rising imports on the future levels of foreign exchange reserves, this bit of information is important.
It shows that quite a sizable part of what we now see as a drain on foreign exchange reserves will soon translate into an augmentation of reserves when the corresponding export earnings materialize.
Of course, a lot depends on demand for garments in the coming months, but these calculations do allow us to assess the rising import payments from a proper perspective.
Short-term movements vs long-term trends: a long view of foreign exchange reserves
In Bangladesh, as elsewhere, we often get worked up with short-term movements in the values of economic variables.
Short-term movements are not unimportant, especially when these provide useful clues about where things might go in the medium to long run.
However, an obsession with short-term movements can be misleading and, by creating unnecessary panic, lead to rash decisions on the part of everyone - governments, businesses, and households.
One variable whose short-term movements have attracted much attention recently is Bangladesh's foreign exchange reserves.
The obsession has become feverish after reserves dropped below a psychological threshold of $40 billion.
It is useful to put these movements in a longer-term perspective.
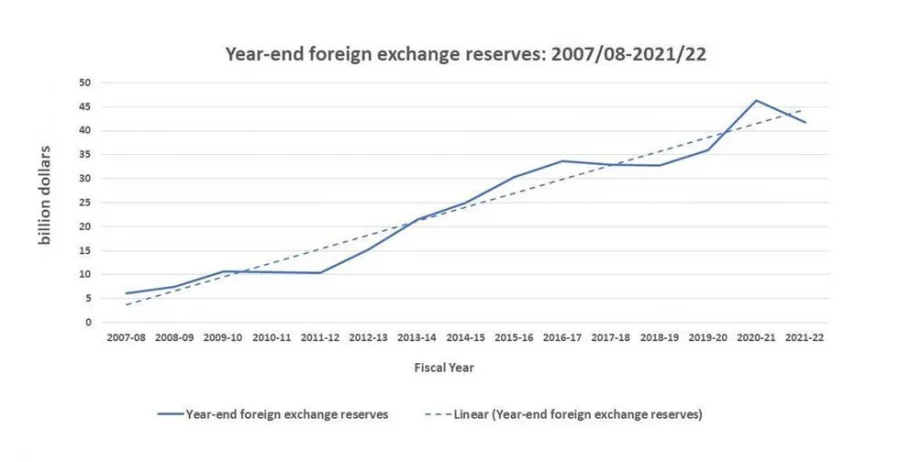
This is done in the following chart (based on Bangladesh Bank data) where we show the fiscal year-end reserve position for the last 15 years (the solid line).
The dotted line is the long-term trend line fitted to the data. Economists often construct such trend lines so that they can look beyond year-to-year (or month-to-month) fluctuations and see what the long-term trend is like.
What do we see? I highlight four things:
a) The long-run trend is that of a steady rise in our forex reserves
b) There have been several years in the past when actual reserves were below the trend line just as there were years when these were above trend
c) Fiscal year 20-21 happened to be a year when the reserves were above trend while fiscal 21-22 (which just ended) was a year when reserves were below trend
d) This drop below trend in the just-ended fiscal year is not unprecedented; there have been several years during the past decade and a half when the shortfall of reserves compared to its trend value was larger.
So, if we did not panic then, why are we panicking now?
There may or may not be reasons to be concerned, to assess that we need to go beyond short-term movements in the underlying economic variables and look at long-term trends.
Relationships between variables: foreign exchange reserves and government expenditures
How much a government can spend is at least partly influenced by how much revenue it can raise through taxes and other sources.
A very fiscally conservative government will try to ensure that its expenditures do not exceed its revenues.
However, such a conservative fiscal stance is not necessary, nor is it always warranted.
Governments may have legitimate reasons to spend beyond its revenue earnings.
Concerned with high rates of poverty and unemployment, and inspired by the development potential of the country, a government may feel an urge to accelerate growth or an obligation to provide social protection.
It may thus explore the scope for getting foreign aid, especially that which is available on concessional terms (low interest rate and long repayment period), in order to fund expenditures beyond what its revenue earnings would allow.
Thus, a government may be fiscally prudent, even if not very conservative, and keep expenditures in line with its revenue earnings but augmented by foreign aid.
If foreign aid is inadequate to meet all its expenditure needs, it may incur some deficit but keep it manageable.
Problems arise when the spending ambitions of a government are driven not merely by legitimate economic or social considerations but also by political calculations.
Governments, especially those that do not come to office through a popular vote in an election, often feel the need to establish its legitimacy, and try to do that through generous spending.
Democratically elected governments are also tempted to spend ‘politically’, such as to shower largesse on political supporters.
In such situations, the alignment between revenues and expenditures is weakened.
Deficits become excessive and unmanageable.
Since deficits lead to debt, unchecked fiscal deficits can create serious macroeconomic imbalances.
Some of our neighbors have learned this lesson the hard way.
In summary, while the options of obtaining foreign aid and running a fiscal deficit are available, a prudent government will try to keep total expenditures in line with revenues so that reliance on aid and deficit financing can be kept manageable.
But, sometimes, when times are good, governments are tempted to drop their guard.
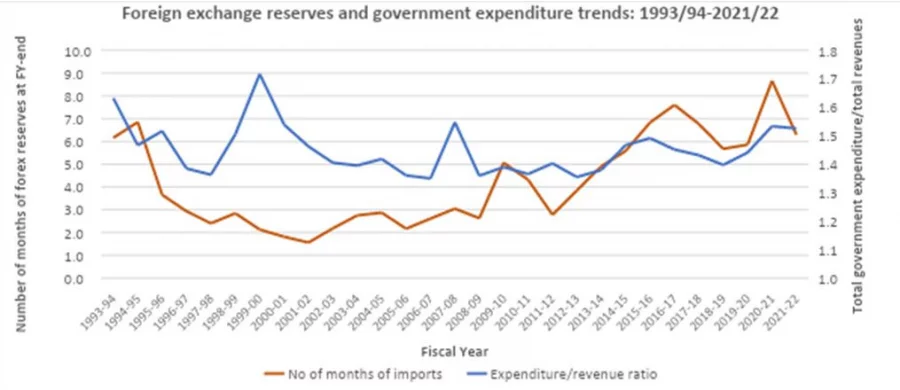
One of the variables that may generate a sense that ‘times are good’ is foreign exchange reserves. This is reflected in the following chart.
Here, we show movements in two variables over the period from 1993-94 to 2021-22 (I was trying to get data for a longer time-period but have not yet succeeded; when I do, I may extend this analysis).
One variable is foreign exchange reserves expressed in terms of months of prospective imports.
The data are from the World Bank’s World Development Indicators.
The other variable is the ratio of government expenditures (both revenue and development expenditures) to government’s revenue earnings (primarily tax earnings but also non-tax revenue earnings).
The data are from various issues of the Bangladesh Economic Review published by the Ministry of Finance.
Let us look at the chart. We see a few interesting things.
First, if we look beyond the year-to-year fluctuations, we can discern a cyclical pattern in the long-run movement of the adequacy of foreign exchange reserves.
The adequacy of reserves steadily fell in the 1990s - the value dropping from six months of imports in 1993/94 to under two months in 2000-01.
An upswing followed, slowly at first but then rapidly, especially in the last decade.
By the end of 2016-17, reserves were equivalent to 7.5 months of imports.
After that, we witness some fluctuations within a narrow range (6 to 8 months of imports).
A peak was reached in FY21 followed by a substantial decline in the last fiscal year.
In other words, we have seen a full cycle from the early 1990s to now; a downturn, followed by an upturn with some signs (although too early to say) that we may be reaching the end of this particular cycle.
Let us now come to the government’s proclivity to spend as reflected in the expenditure/revenue ratio.
The ratio has largely remained within a narrow band of 1.35 to 1.5.
In other words, expenditures have exceeded revenue earnings by 35-50% during this (almost) 30-year period.
If we look beyond some of the exceptional years when the ratio was unusually high, we can observe a pattern.
There is a cyclical movement too in this ratio, a downward trend from the early 1990s that lasted about a decade and a half, followed by a period of remarkable stability from 2008-09 to 2012-13, and then an upswing.
There appears to be an interesting relationship between the two variables.
When the stock of foreign exchange reserves became less and less adequate in the 1990s, the government’s fiscal stance became increasingly conservative.
In 1993-94 when foreign exchange reserves were adequate to meet 6 months of imports, expenditures exceeded revenues by more than 60%.
By 2000-01 when reserves were equivalent to only about 1.5 months of imports, the expenditure/revenue ratio had fallen 1.46.
After that the downward trend was reversed and the adequacy of foreign exchange reserves started increasing albeit slowly.
The government’s fiscal stance remained prudent in the face of this slow improvement but as the increase in reserves accelerated after 2011-12, we see a loosening of the fiscal stance.
This is reflected in an increase in the expenditure revenue ratio.
We may note the slight dip during 2016-17 to 2018-19, but this was less due to a slowdown in spending than to a significant improvement in our revenue effort (the revenue effort has since weakened while expenditures have gone up, partly due to the pandemic).
If we leave out the three exceptional years of 1998/99- 2000/01, the correlation coefficient between the two variables (adequacy of reserves and expenditure/revenue ratio) is 0.58.
That shows a moderately strong correlation between the variables suggesting that when the adequacy of reserves goes up, governments may feel that the ‘times are good’ and are tempted to be fiscally profligate.
The purpose of this article was not to provide a thorough analysis of the drivers of government spending.
That would require a more elaborate exercise.
Rather, I wanted to show how examining some data points over time can point to some possible relationships, in this case between some developments on the external front (reserve accumulation) and government behavior (spending).
Many other potential relationships can be suggested by such simple exercises, the validity of which can then be tested by more rigorous analysis.
If nothing else, such exercises may help us go beyond generalizations, innuendoes, and sensation-mongering to asking the right questions.
That way, data can indeed help us come closer to the truth.
Perhaps Mark Twain, or the person he was quoting, was a little too harsh on statistics!
The author is an economist, previously with an international development agency